Help
OVERVIEW
Introduction
PseRAACBook is the online repository and server of reduced amino acid descriptor, which incorporates the following three parts:74 types of reduced amino acid were manually extracted to generate 673 reduced amino acid clusters (RAAC). A multi-layer browser tool was introduced for users to easily navigate and filter RAACs;
The reduced analysis server was developed to analyze primary sequence of protein. Three correlation parameters (k-tuple, gap, λ-correlation) are used to define k-tuple reduced amino acid composition. And the analysis not only provide fasta, csv and libsvm files for user downloading, but also create visualization, including the reduced web logo of motif elements, sequence alignment, composition comparison between natural and reduced amino acids, a correlation heatmap of reduced amino acids features for machine learning.
The machine learning server supports the model training of protein classification based on Support Vector Machine (SVM), K-Nearest Neighbor (KNN), Random Forest(RF). The evaluation performance contains ROC, AUC, MCC and so on.
Citation
Lei Zheng, Shenghui Huang, Nengjiang Mu, Haoyue Zhang, Jiayu Zhang, Yu Chang, Lei Yang*, and Yongchun Zuo*, PseRAACBook: a web server of reduced amino acid alphabet for sequence-dependent inference by extending Chou’s PseAAC and PseKNC. In submission.Feedback
We welcome any feedback. If you find errors, omissions, or if you want to suggest new RAACs or applications being added to PseRAACBook, please let us know. You can contact us by Email (yczuo@imu.edu.cn, baimoc@163.com).BROWSE
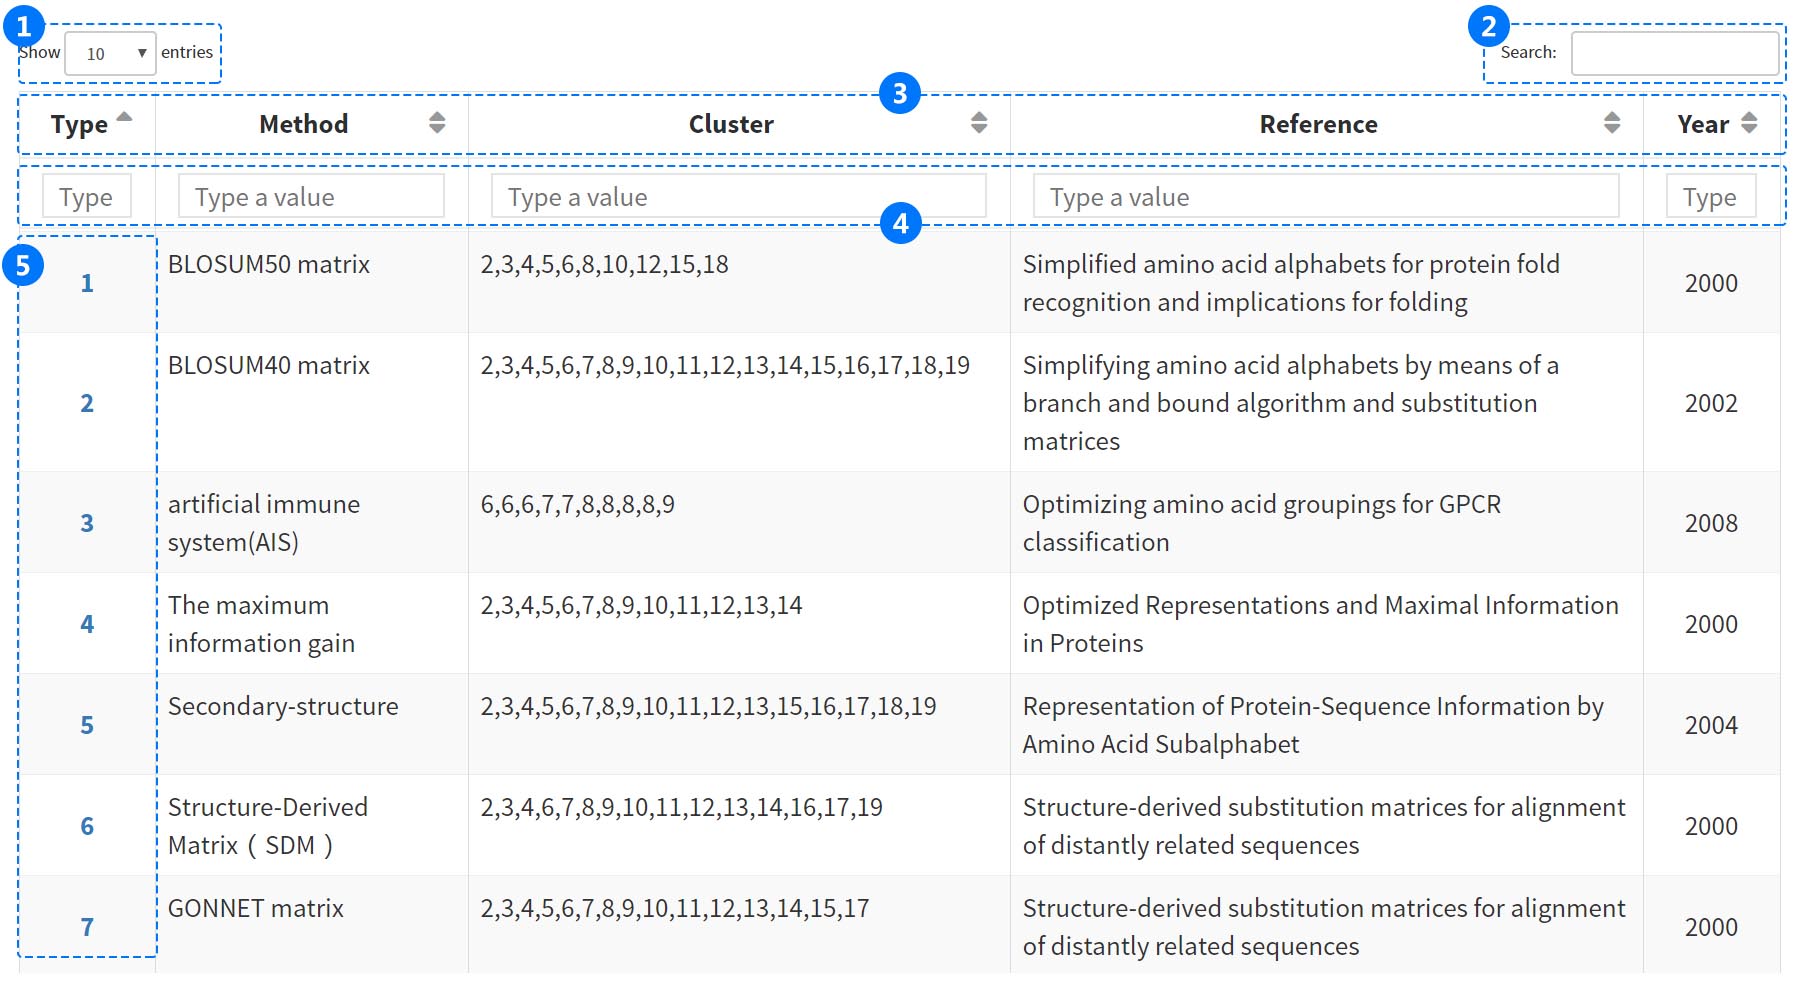 Users can ambiguously search for data by type ID, method, cluster, reference and year entries in the browser tool. The filter can greatly help users obtain entries which meet their needs among the massive information.
(1) Select more entries from the popup menu.
(2) Filter all column results by inputbox from database.
(3) Sort the column names in order.
(4) Filters single column results by inputbox from database, e.g. by method (BLOSUM62), by year (2018).
(5) Click the "Number" button to visit the INFORMATION page.
INFORMATION
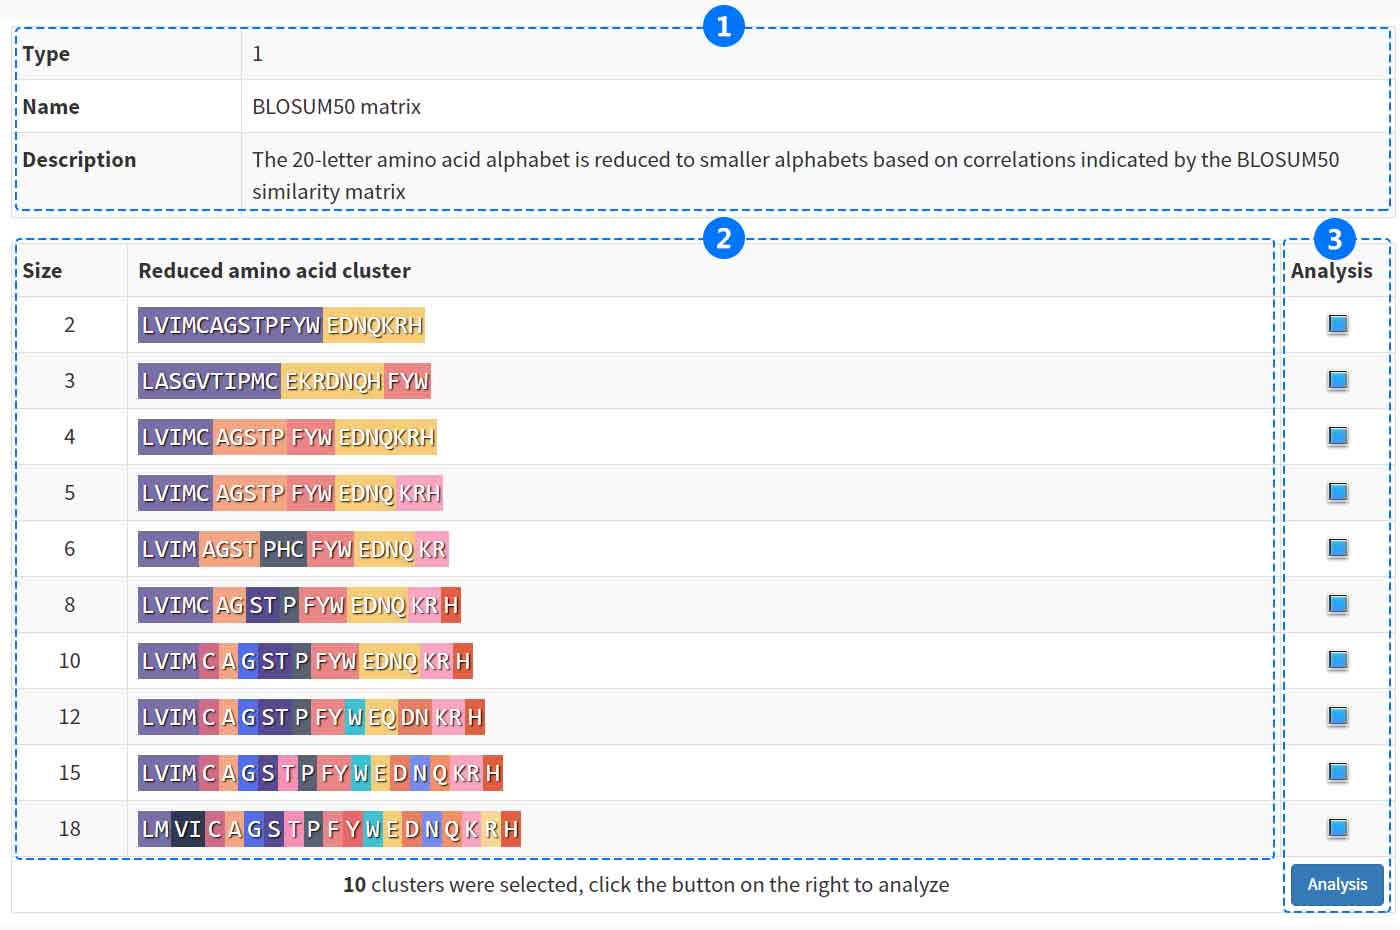 The type id, name, description and other are showed in the information page. It is important that the amino acid reduction clusters for each method are visualized by clustering with different colors. Users can easily analyze the selected RAAC by clicking "Analysis" button to enter the ANALYSIS.
(1) The information includes selected type, name, description and reduced amino acids cluster.
(2) The reduced amino acids cluster (RAAC) are shown as a bar with amino acid residues of different colors.
(3) Click the button to visit the analysis interface with selected RAAC types.
ANALYSIS
The online server was developed to reduce primary sequence of protein. Three correlation parameters (k-tuple, gap, λ-correlation) are used to define k-tuple reduced amino acid composition. Users can analyze the primary protein sequences and get analysis results in the following three steps:
Step1. Input Query Sequence
Two ways are provided, the one is to upload fasta file with natural amino acid sequences , another one is to paste sequences into the input box.Step2. Alphabet Selection
This parameter is selected in a two-dimensional selection box with the alphabet types and amino acid cluster sizes, which are recorded in the PseRAACBook database.
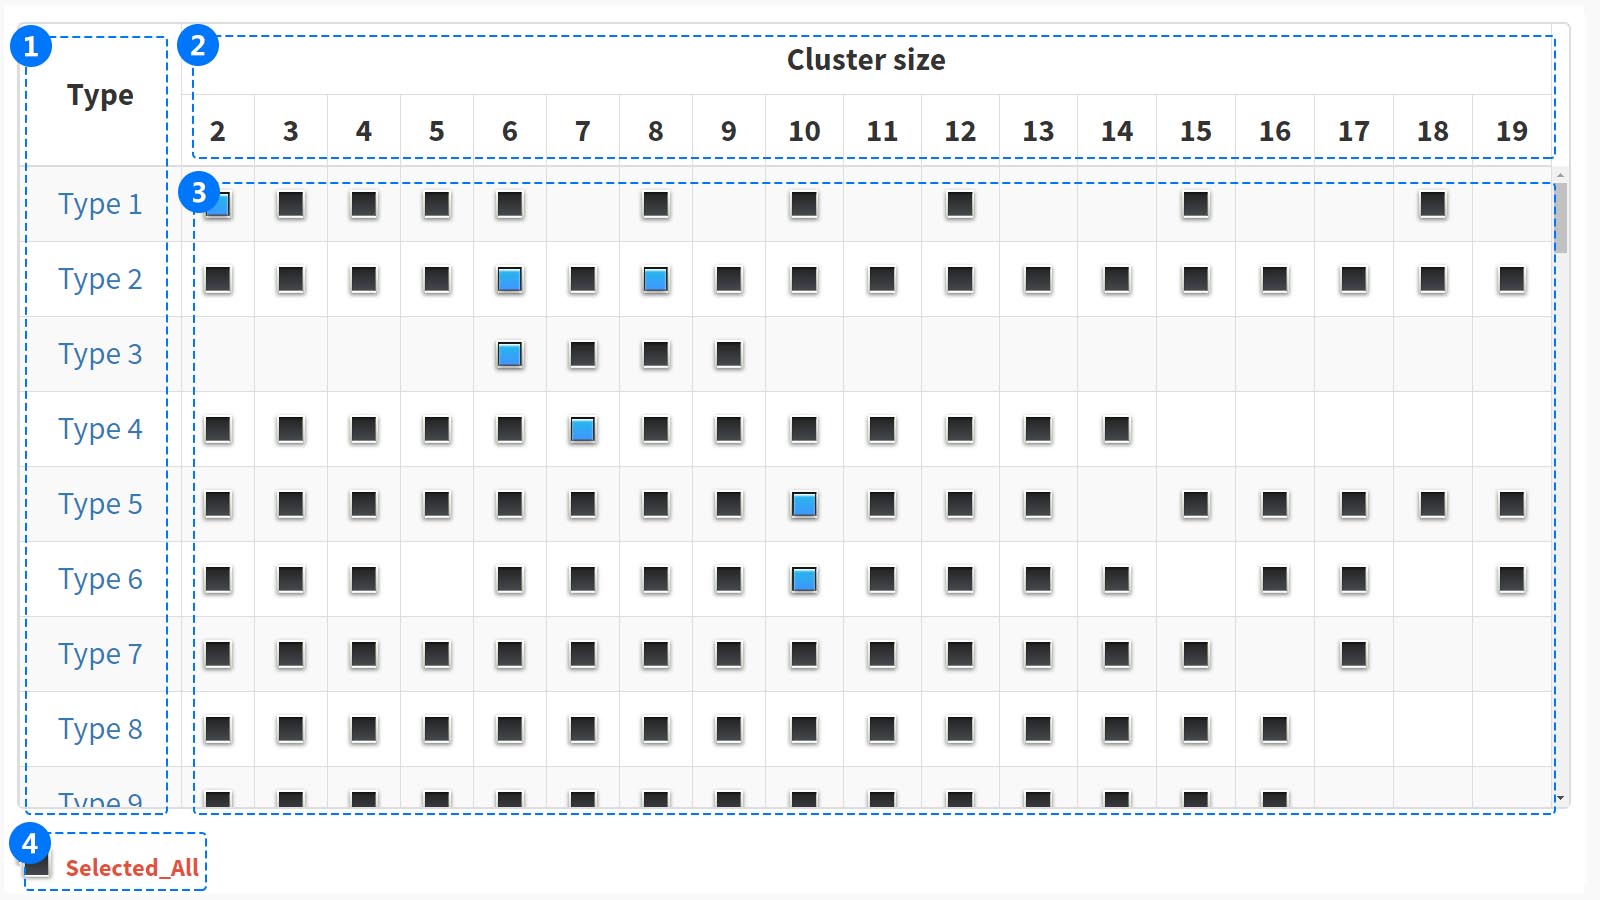
(1) In the "Type" column, each number represents an amino acid alphabet reduction type. If you hover mouse over the type, will get a brief description of type.However, if you click on the type, you will be taken to the information page.
(2) In the "Cluster size" column, the row shows all clustering information, and the number indicates cluster size.
(3) Click the gray button to select the cluster and the button will change to blue.
(4)
Click the "Selected All" button, at the bottom of the box two-dimensional selection box, to select all the RAAC types.
Step3. Parameters Selection
The K-tuple, g-gap and λ-correlation are the three main parameters to generate the reduced amino acid compositions of protein primary sequence. The detail explanation is as follows:
i. k-tuple
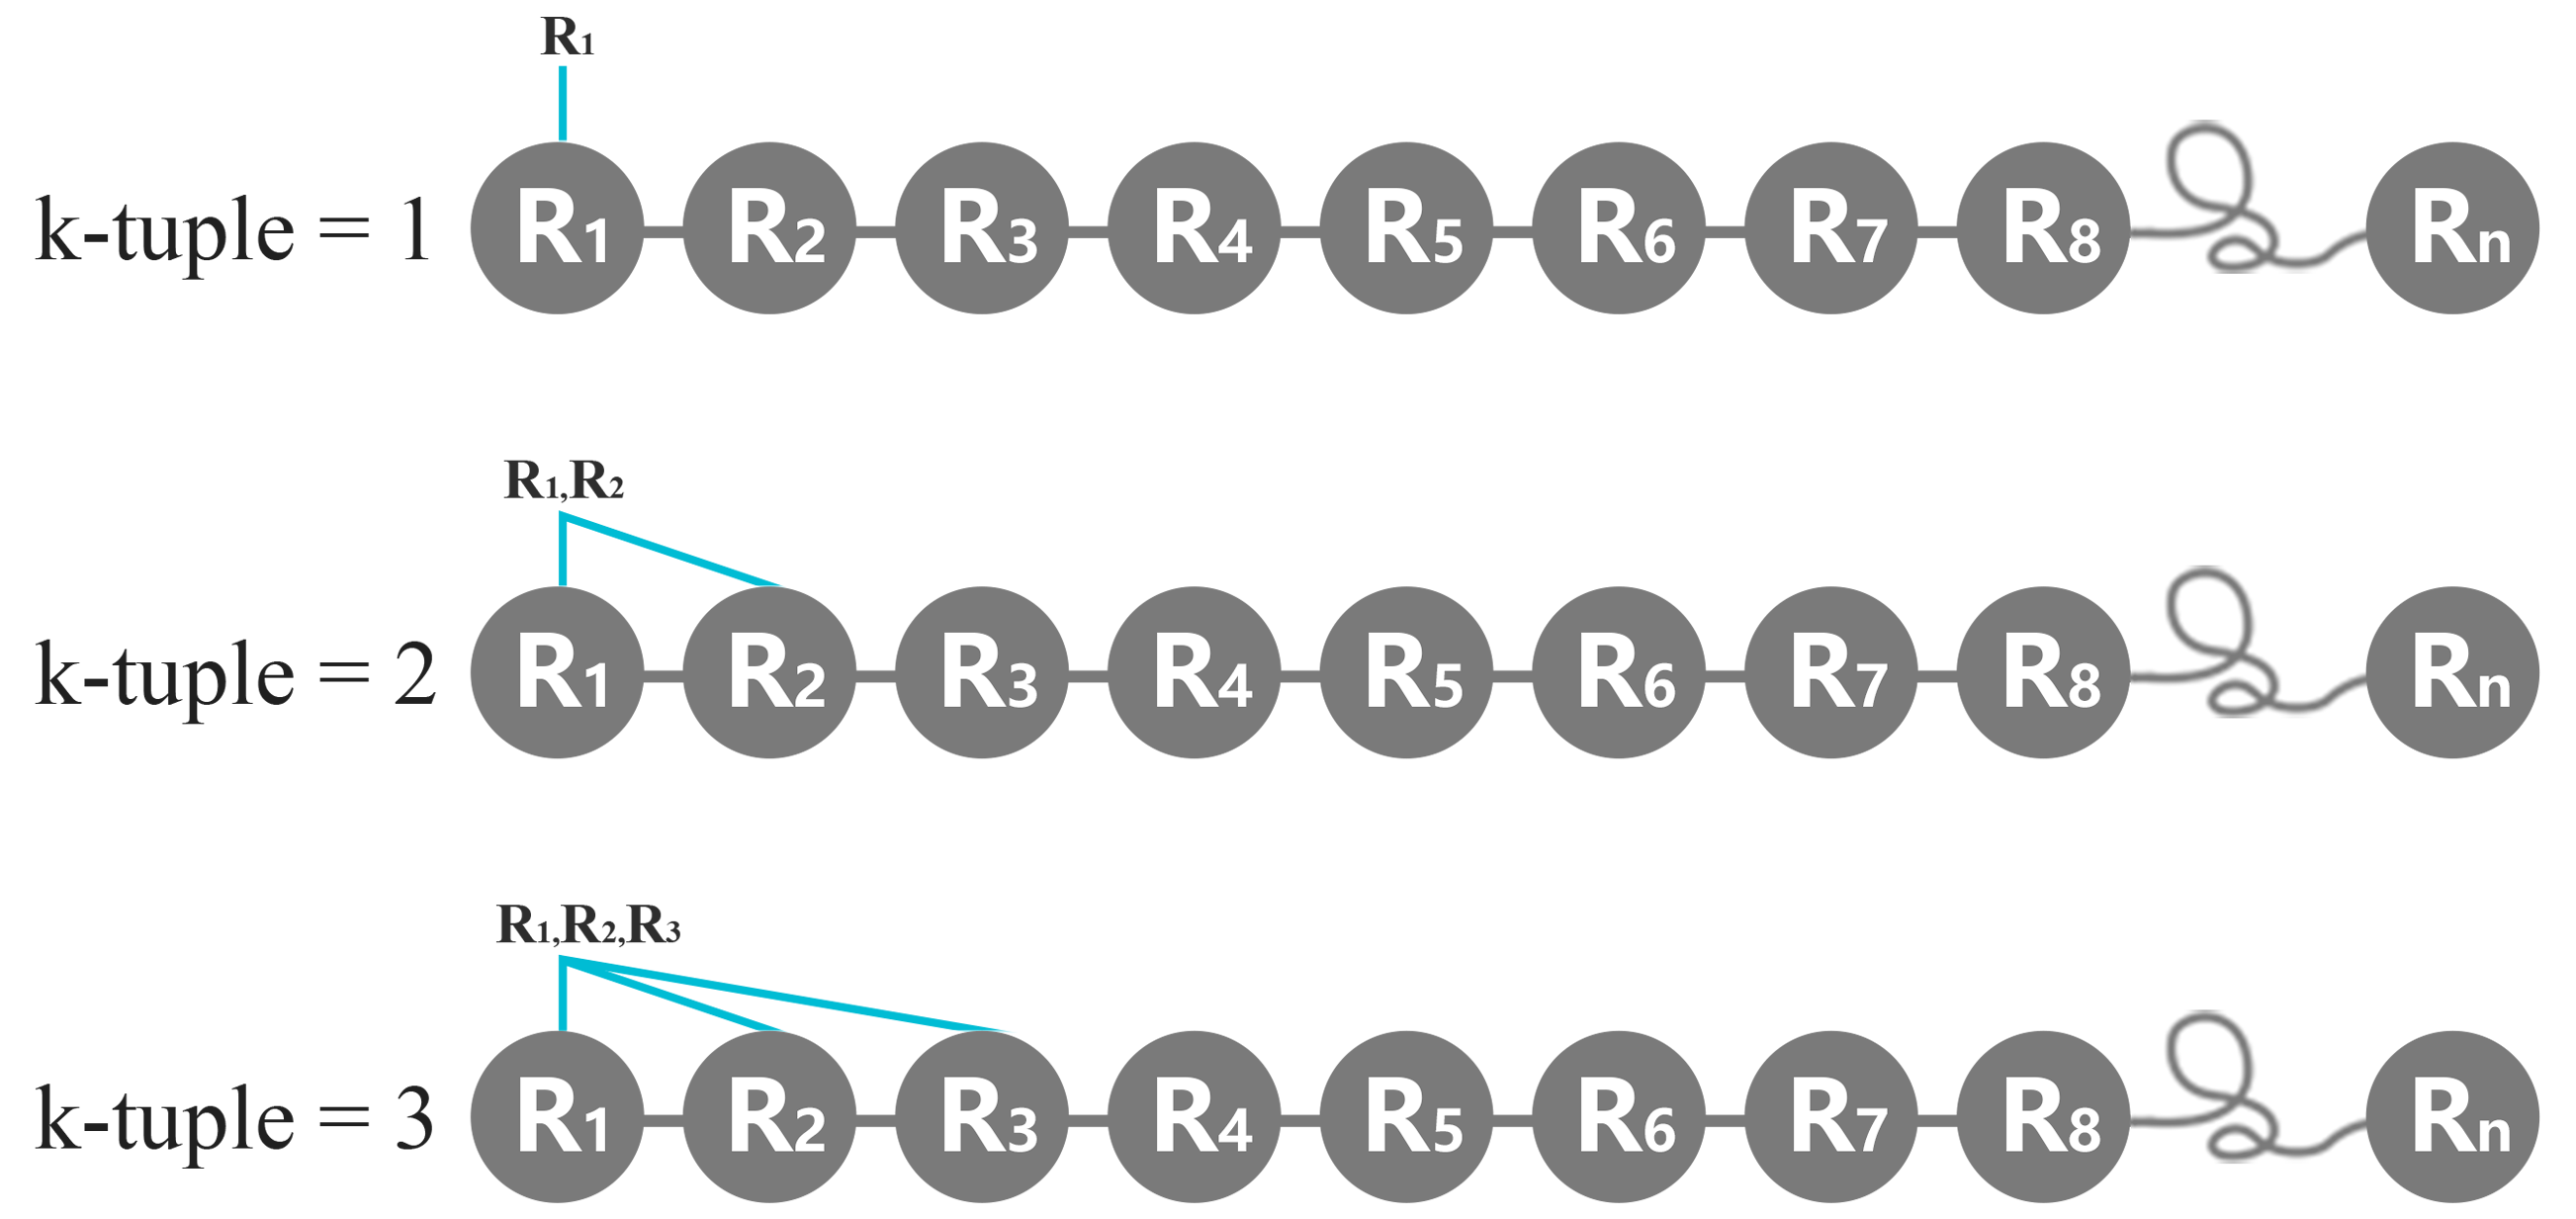
The value of k-tuple in K-tuple is identical to what other researchers have defined. The K-tuple value represents the number of peptide. For example, K=1 means a monopeptide or amino acid, K=2 represents a dipeptide, K=3 represents a tripeptide, and so on. In a typical K-tuple analysis, one usually slides the window of width K amino acids along the protein by one residue at a time. That is, with K = 1, for a protein with N amino acids represented by R1, R2, . . . , RN, the frequency composition of every natural or reduced amino acids will be calculated. With K = 2, it appears we wish to count the dipeptide frequency along the protein by one residue at a time. For a protein with N amino acids, with k=2, there are totally N-1 dipeptides in the whole protein chain as follows, R1R2, R2R3, R3R4, . . . etc.
ii. g-gap
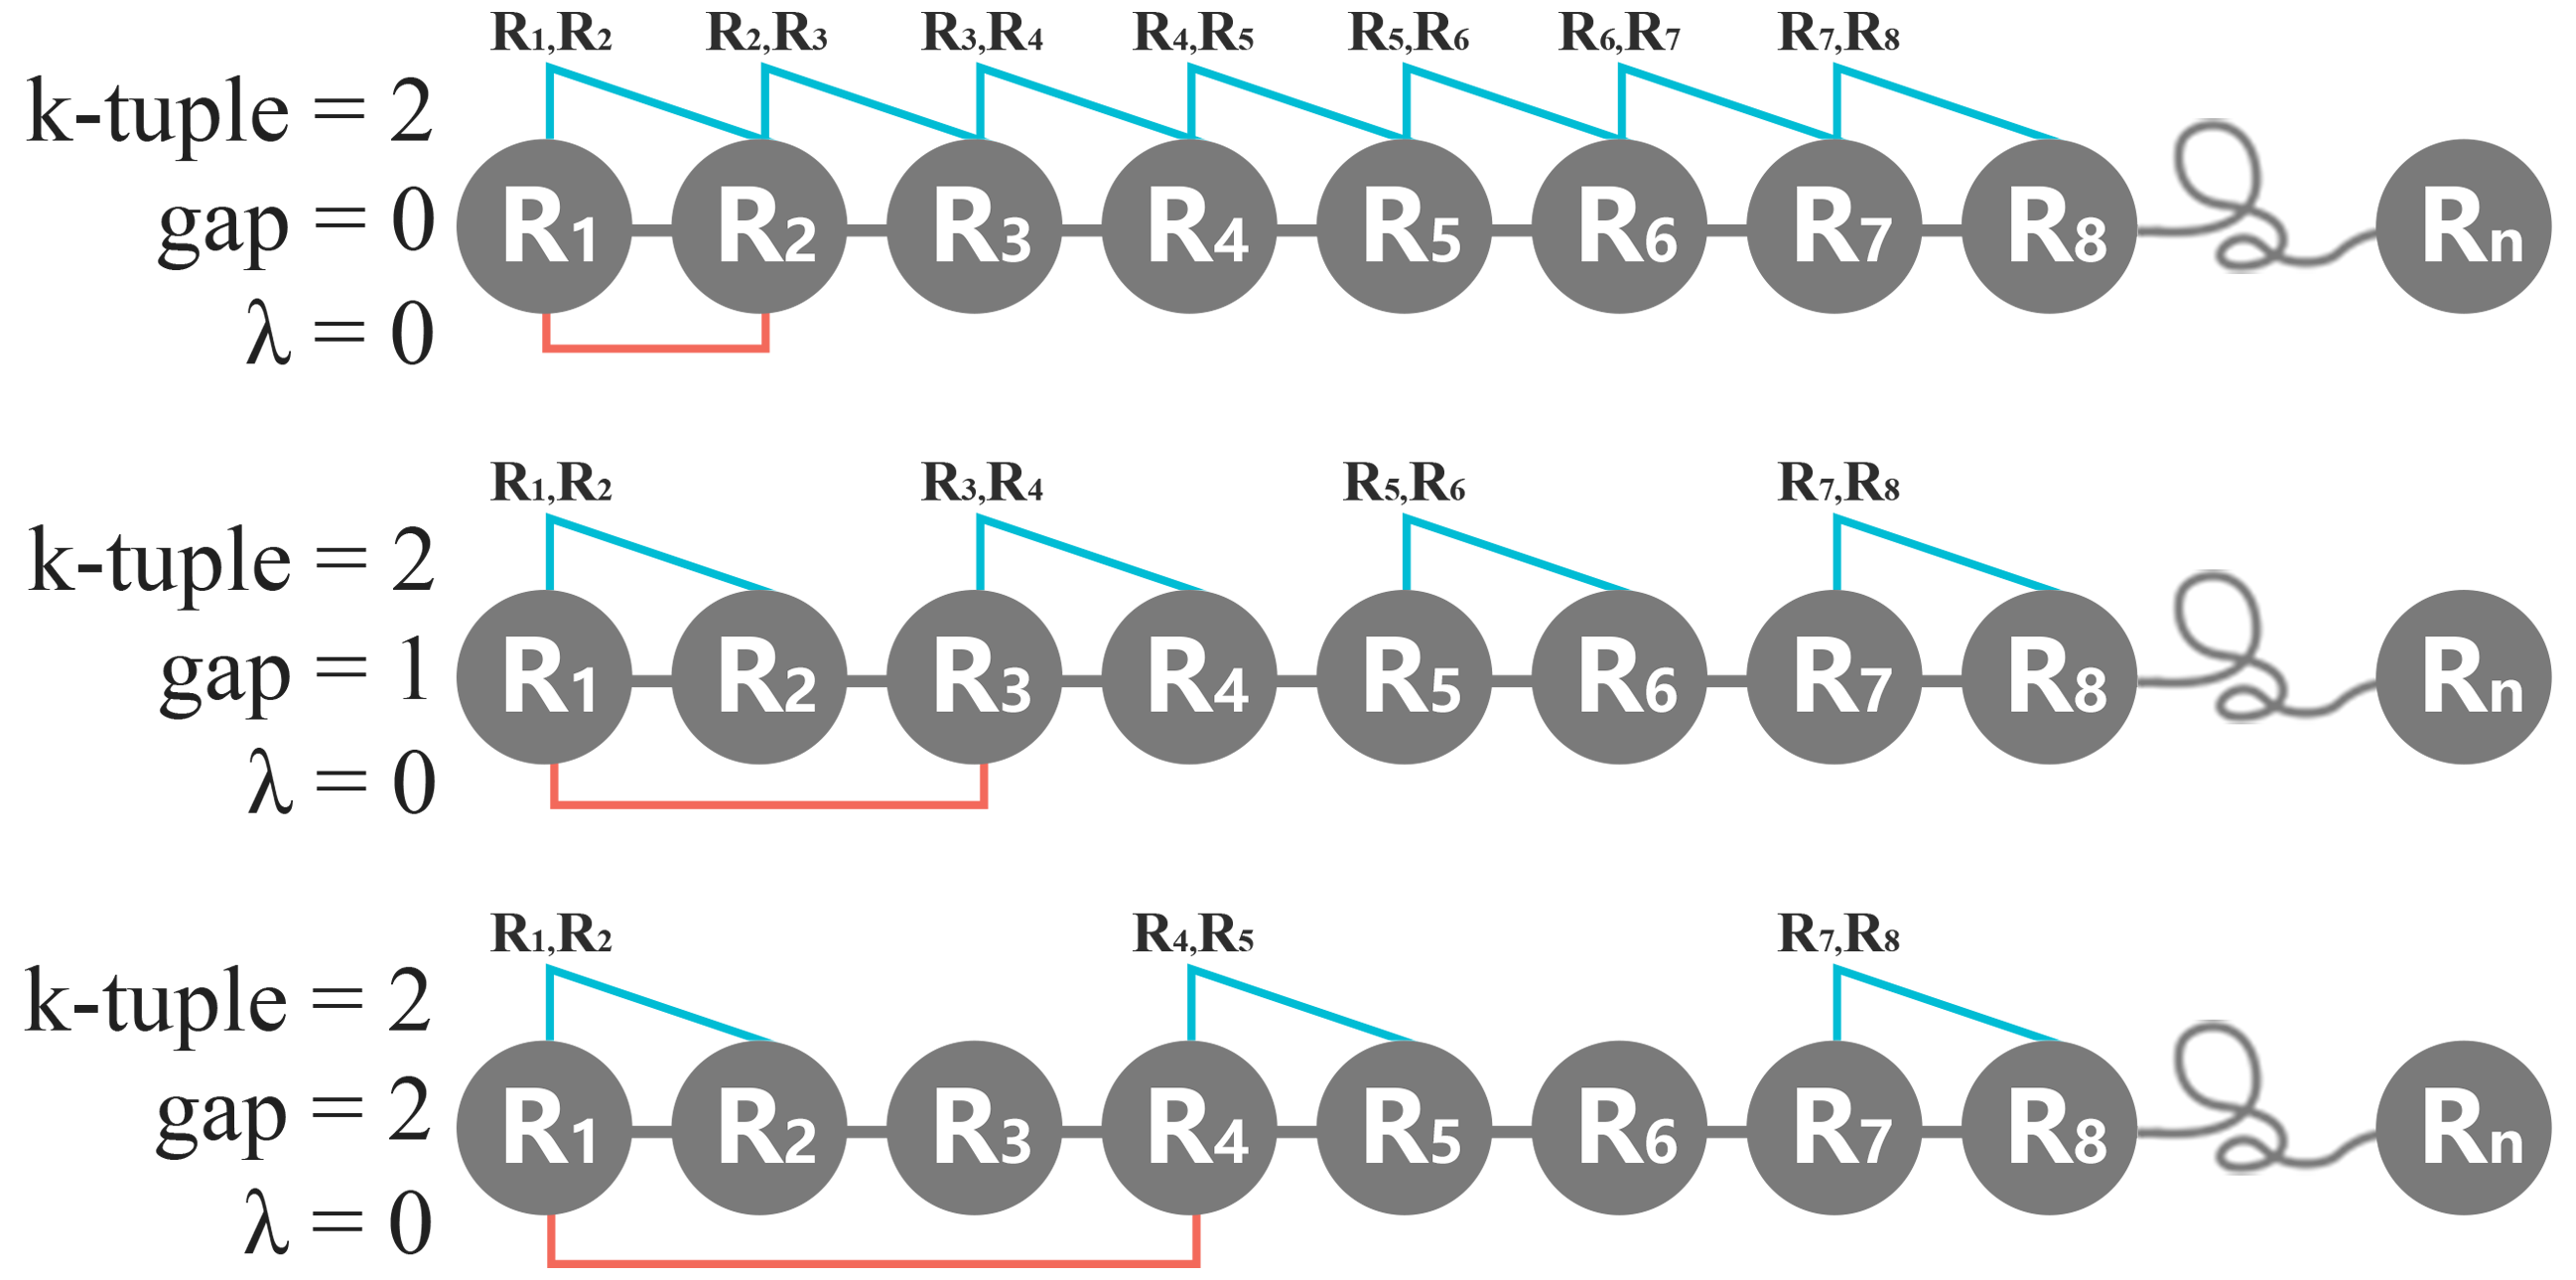
The value of g-gap represents the inter-gap number between two nearest amino acid or K-tuple peptides along the protein. For a protein with N amino acids represented by R1, R2, . . . , RN, as the reviewer understands, introducing g 1 will reduce the number of counted amino acid or K-tuple peptides by a factor of (g + 1). With k=1, g = 3, indeed, there is only 1/4 of the amino acids counted along the whole protein sequence as follows, R1, R5, R9, ... etc.. With k=2, g=1, our aim is to count the dipeptide frequency along the protein by skipping one residue in every slide as follows, R1R2, R3R4, R5R6, ... etc. In short, the g-gap represents the number of skipping residue in each slide along the protein.
iii. λ-correlation
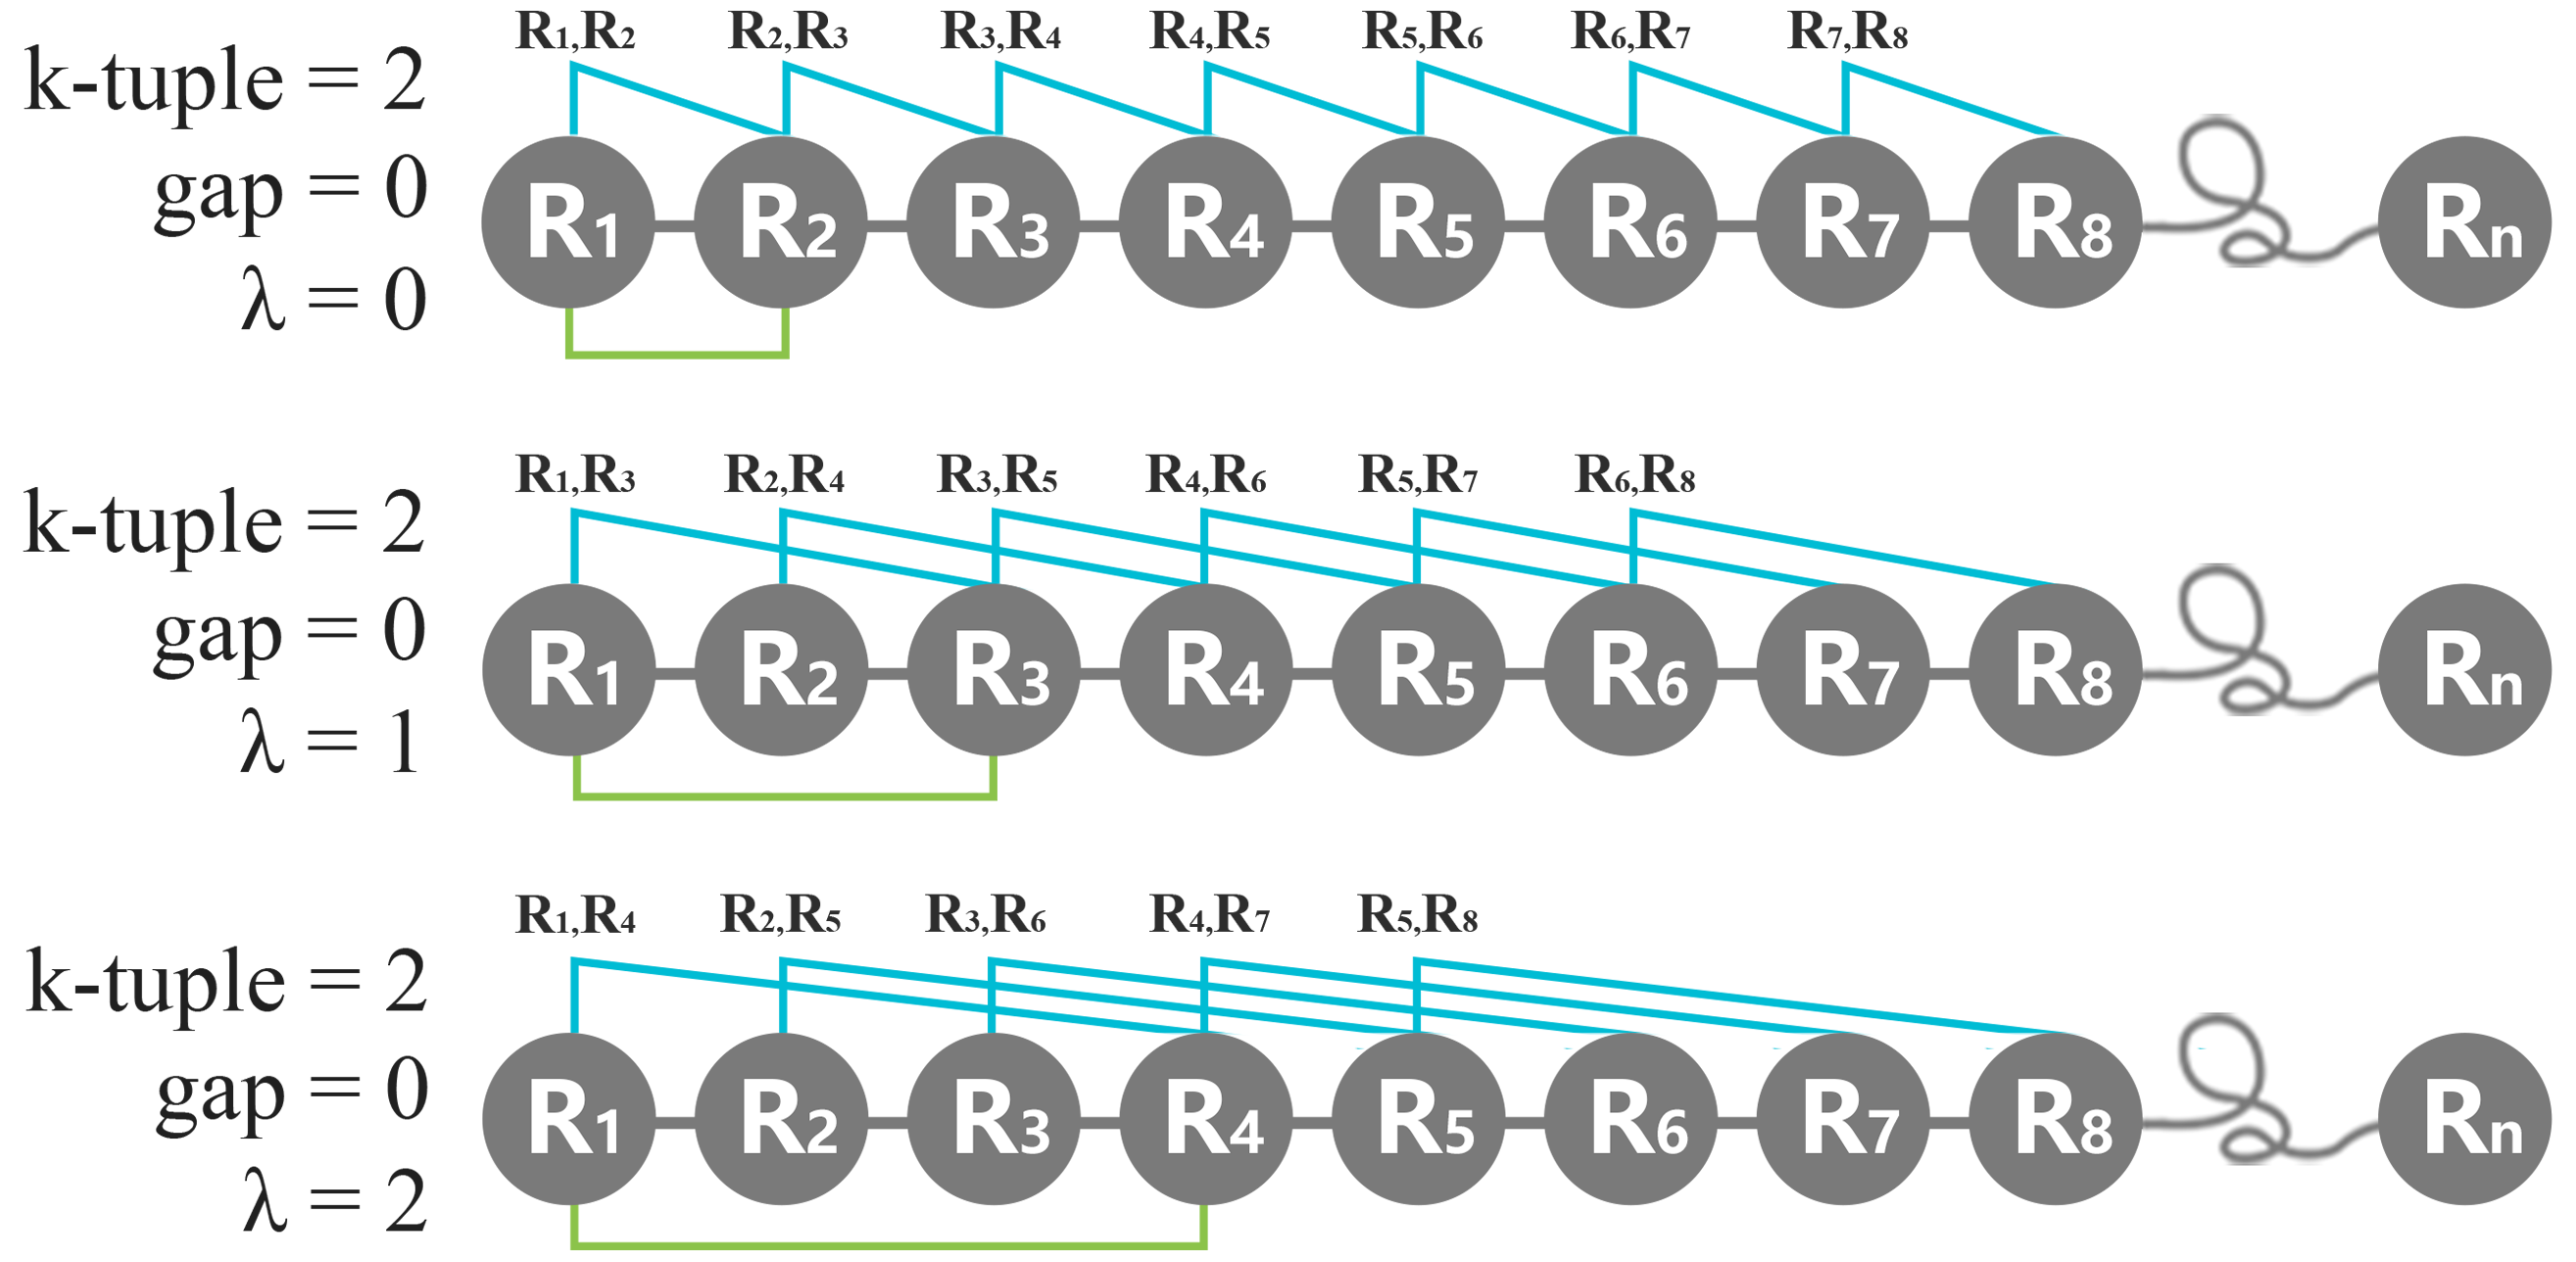
The value of λ-correlation represents the gap number of every two nearest amino acid in the K-tuple peptide interval. Obviously, k>=2 is necessary for making λ meaningful. For example, for a protein with N amino acids represented by R1, R2, . . . , RN, with k=2, λ=1, our aim is to count the dipeptide frequency from the combinations of R1R3, R2R4, R3R5, . . . etc. Then when K =3 and λ = 1, our aim is to count the tripeptide frequency from the combinations of R1R3R5, R2R4R6, . . . etc. In short, the λ-correlation represents the number of skipping residue between every two nearest amino acid within the K-tuple peptide interval.
iv. Multiple parameters
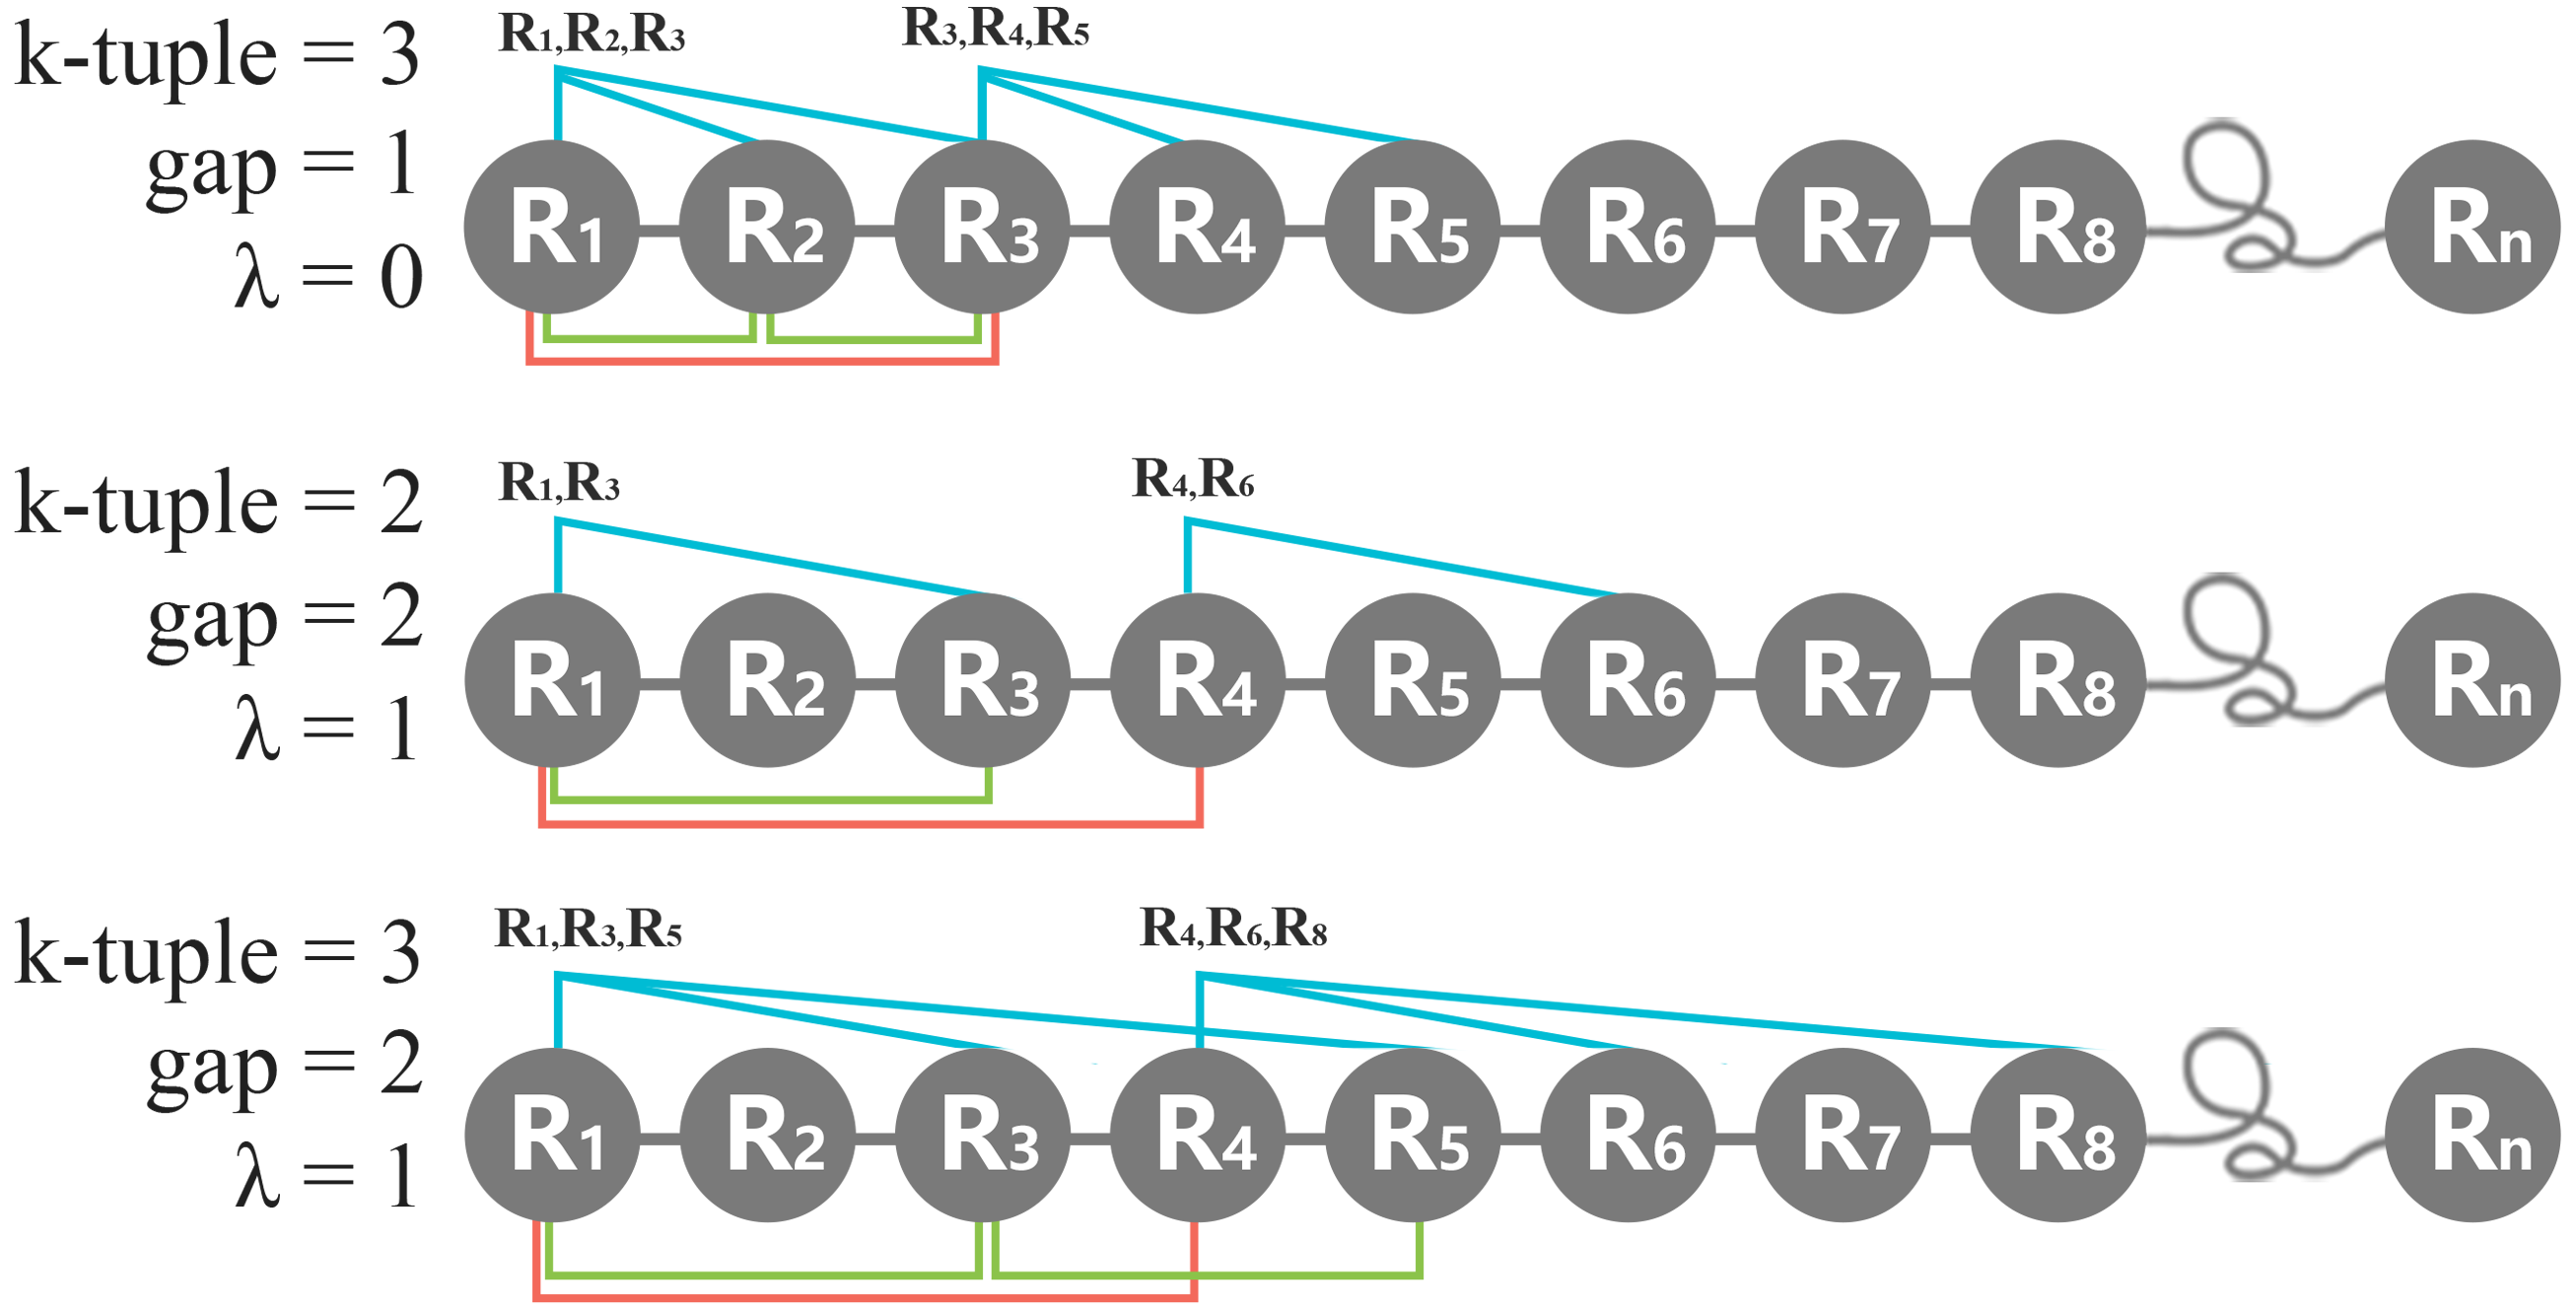
Taking K =3, λ=1, g=2 as an example, the intra-gap number of within tripeptide interval is 1, and the number of skipping residue of tripeptide in each slide is 2. In the calculation process, the combination is R1R3R5, R4R6R8, R7R9R11, ...etc.
Finally, if everything is ready, users can click the "Analysis" button to get the PseRAACBook report.
Analysis Report
Each RAAC types will generate corresponding fasta, csv and libsvm vector files for download, and visualize the data according to the primary sequence, feature, and conservative regions of the protein.i. Download List
Each RAAC types provide corresponding fasta, csv and libsvm vector files for download.All these files are compressed into a zip file.
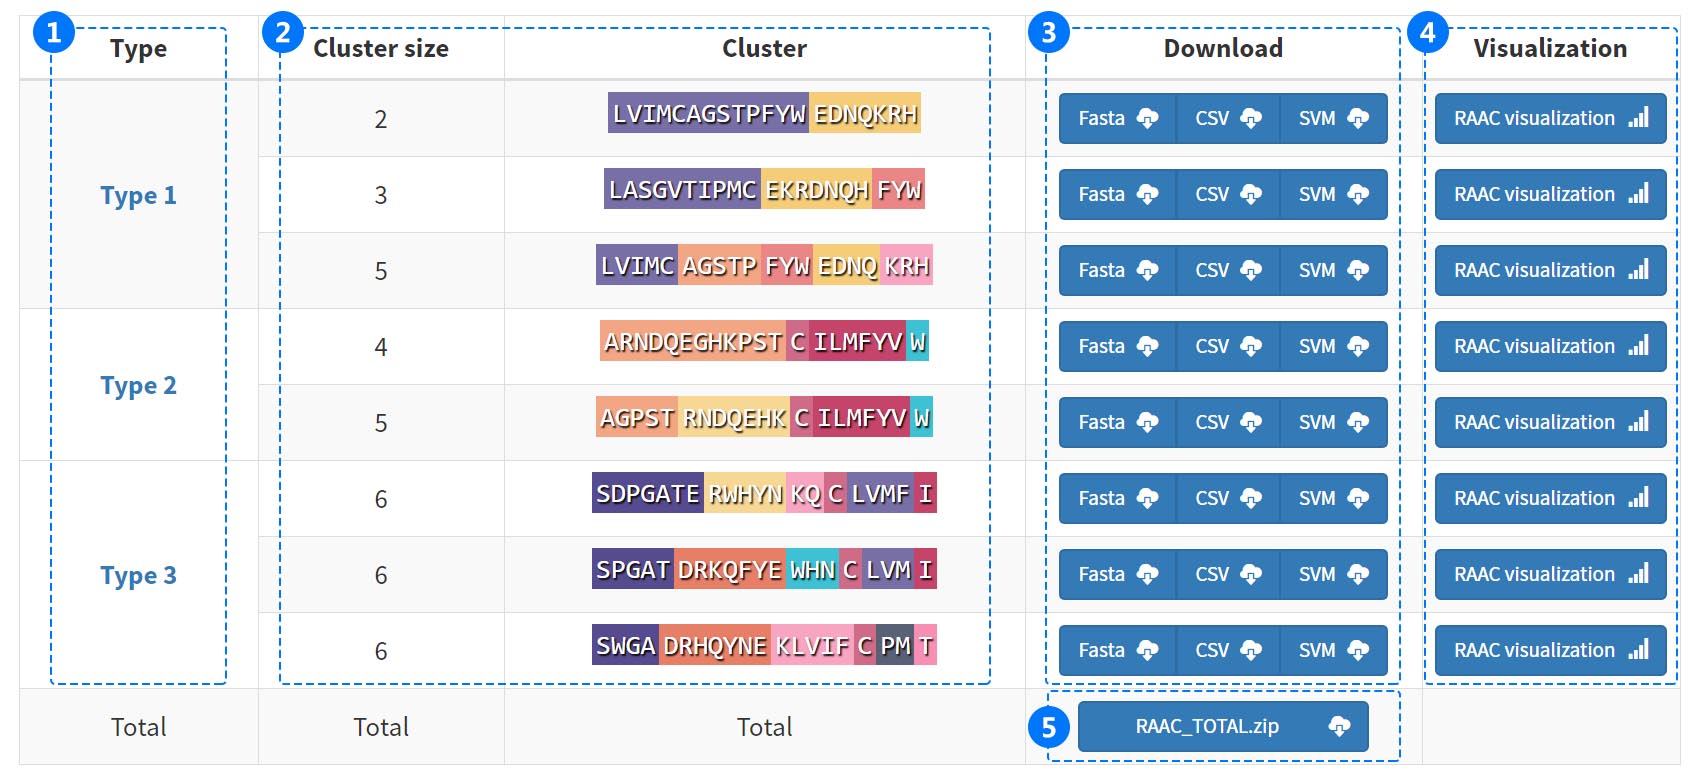 (1) Click the types to visit INFORMATION.
(2) The reduced amino acids cluster (RAAC) are shown as a bar with amino acid residues of different colors.
(3) Download three vetor files (fasta, csv, svm) from bule button for future research.
(4) Visualize the data according to the primary sequence, feature, and conservative regions of the protein.
(5) Download all results in a compressed file (ZIP format).
ii. Sequence Visualization
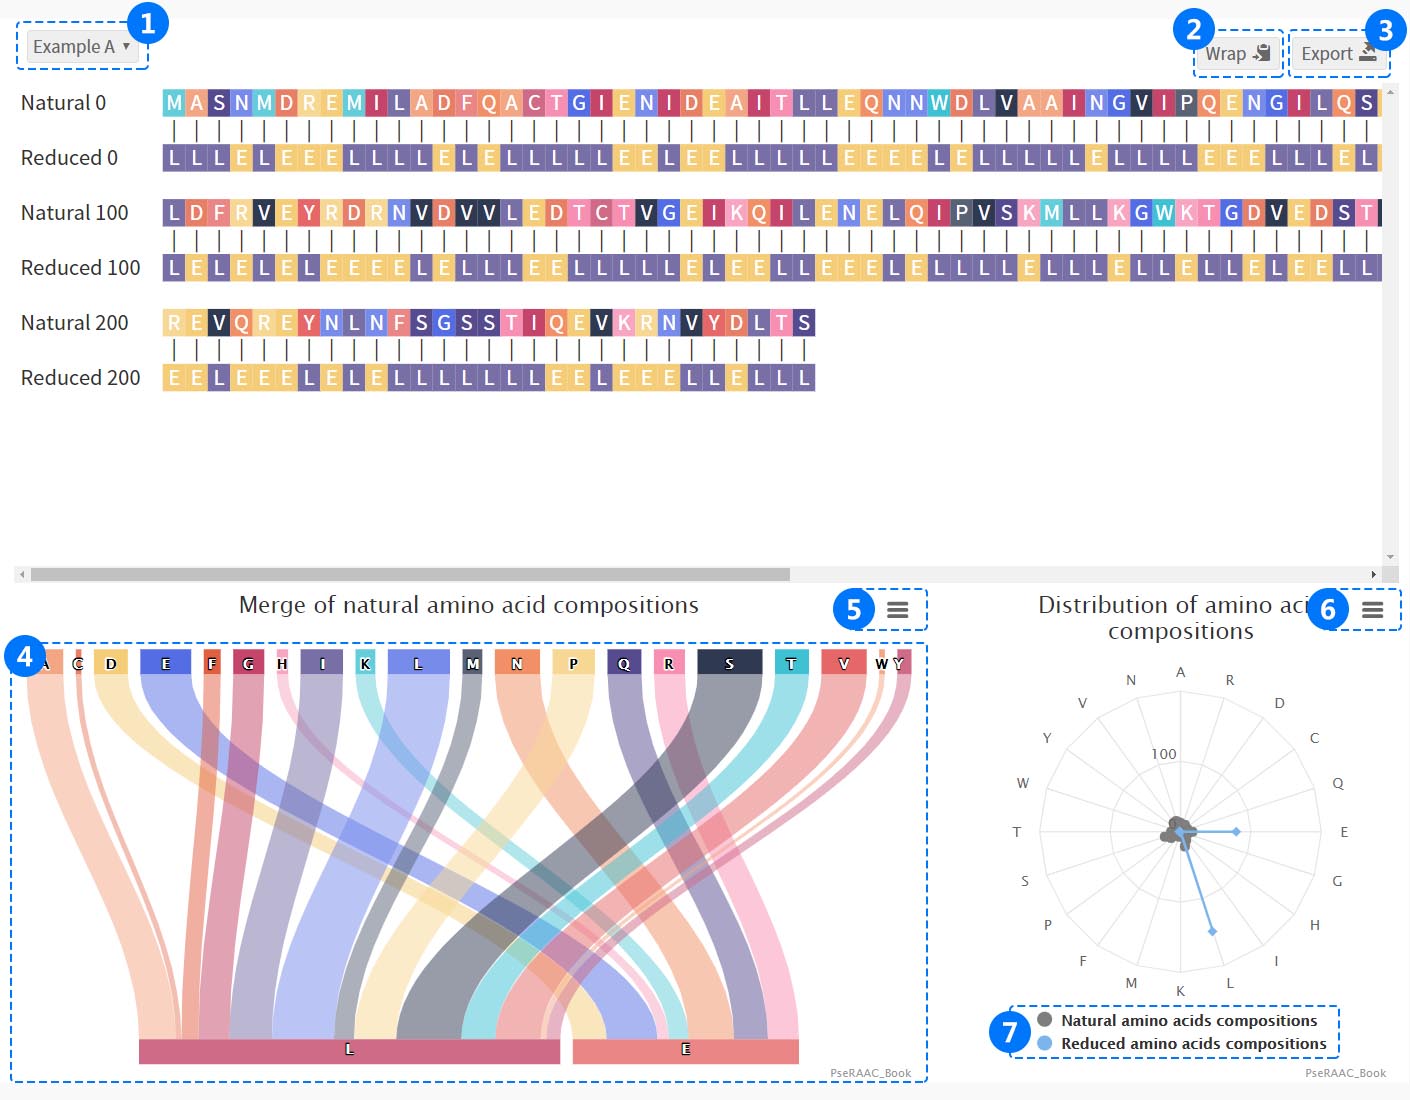 (1) Select different sequences to view and filter.
 (2) Select the maximum number of amino acids displayed in one row.
(3) Download png and svg images, fasta, csv, txt, json files and PDF documents for study.
(4) The merge of reduced amino acids composition displays the relationship between natural amino acid and reduced amino acids letters.Users can click on amino acids to view the detailed reduction process.
(5,6) Download png, jpg, svg, pdf.
(7) Click the legend to check the distribution of reduced and natural amino acid components.
iii. Feature Visualization
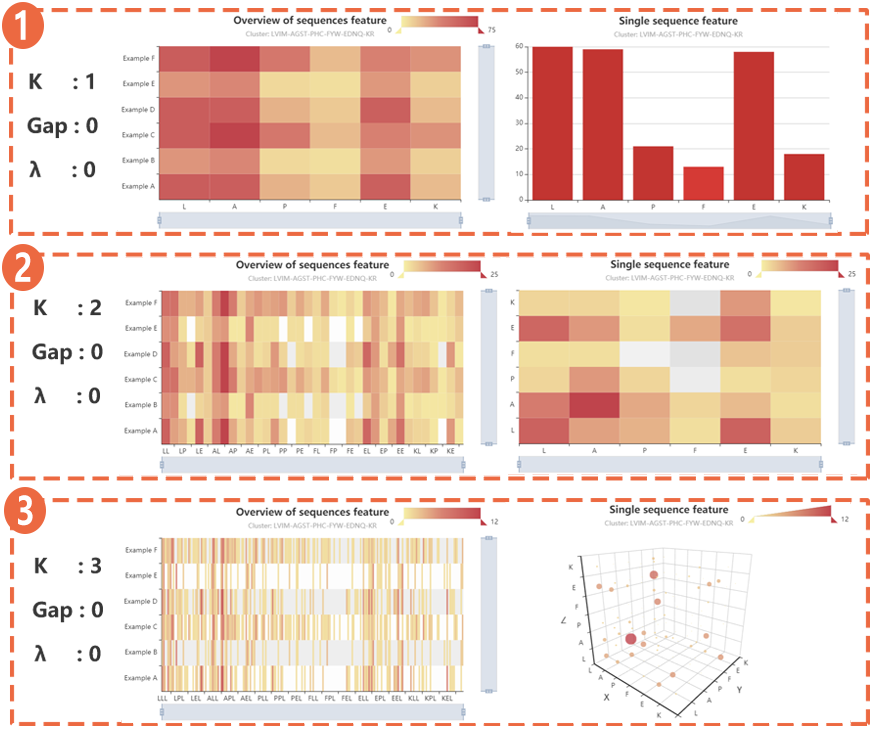 (1) When k-tuple = 1, the distribution of each component in all sequences and the distribution of each component in single sequences.
 (2) When k-tuple = 2, the distribution of each component in all sequences and the distribution of each component in single sequences.
(3) When k-tuple = 3, the distribution of each component in all sequences and the distribution of each component in single sequences.
iv. Reduced Logo Visualization
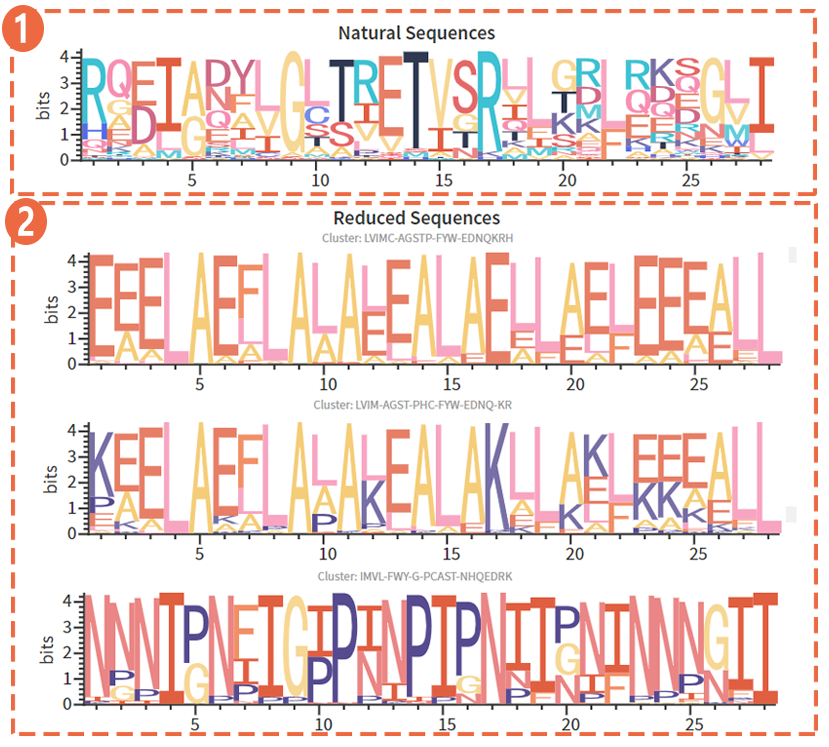 (1) Amino acid distribution of each site of the natural sequence, based on the alphabet with 20 amino acids .
 (2) Amino acid distribution of each site of the reduced sequence, based on the reduced alphabet.
MACHINE LEARNING
The machine learning server supports the model training of protein classification based on Support Vector Machine, K-Nearest Neighbor, Random Forest.

Step1. Enter Dataset
(1)Upload the fasta file as datasets.In order to avoid reducing the processing efficiency of the web server for other users, we limit the uploading of files up to 200 KB and fasta as the file extension.
(2) Click "Example" button to select example data.
Step2. Parameters Selection
(3)The k-tuple and types are used to generate k-tuple reduced amino acid composition features.
Machine learning algorithms are uesed to train the classifier models
(4)Click "Reset" button to reset all settings.
(5)Click "Submit" button to start the training program for the classifier.
Machine Learning Report
i. Model Evaluation
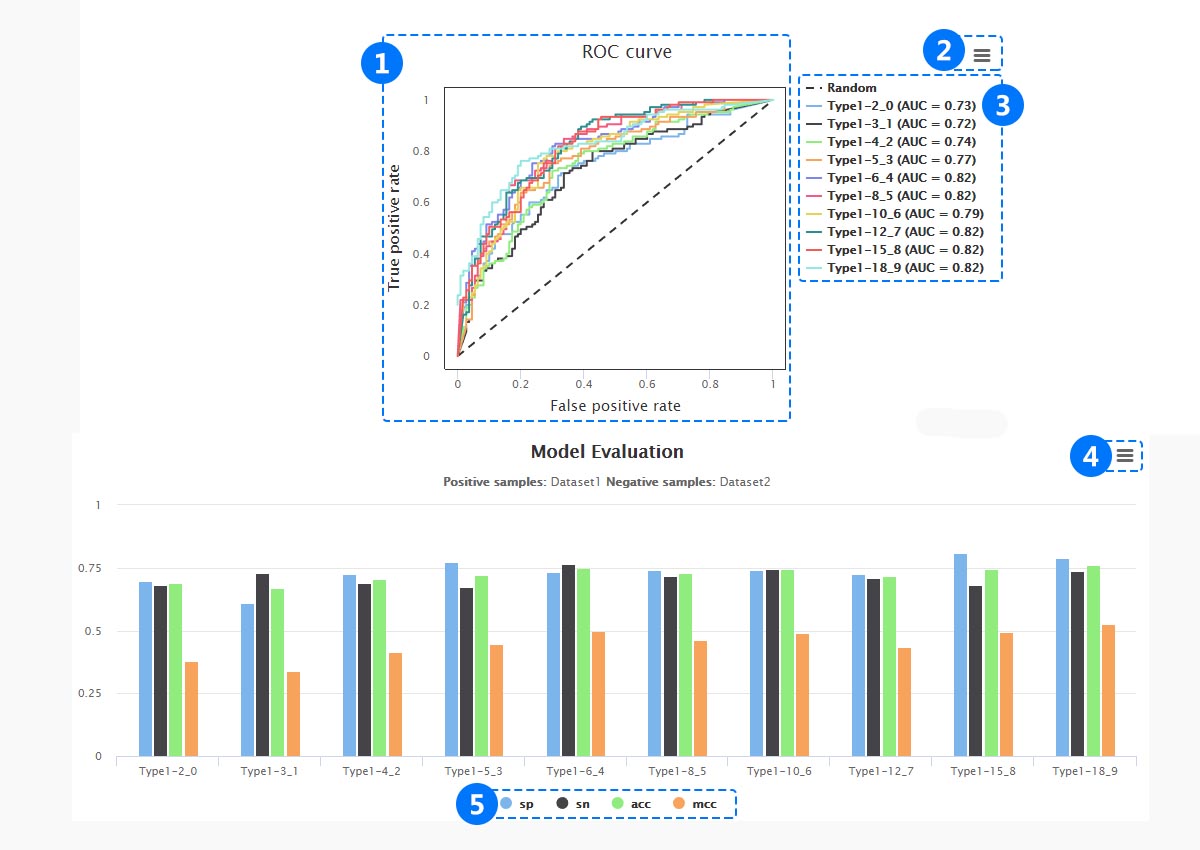 (1) The different cluster sizes are showed in the receiver operating haracteristic (ROC) curve.
 (2) Download png, jpg, svg, pdf files.
(3) Click different cluster size and the corresponding the value of Area Under Curve (AUC).
(4) Download png, jpg, svg, pdf files.
(5) Evaluation of machine learning, including, Specificity (Sp), Sensitivity (Sn), Accuracy (Acc) and Mathew’s correlation coefficient (Mcc) .
ii. Download
 (1) Download fasta, csv and libsvm vector files.
 (2) Download classifier models.
(3) Download all results in a single file (ZIP format).
APPLICATION
Currently, RAAC has been used in many cases, such as iDPF-PseRAAAC , iHSP-PseRAAAC, Antimicrobial Peptide Scanner, Bastion6, iDNA-Prot|dis etc. A recent example of a collaborative focus within the PseRAACBook is the identification of secretory protein of Malaria Parasite using RAAC, implemented as the ISP-RAAAC. This is an online implementation of SVM method, which makes the classification based on reduced amino acid alphabet from PseRAACBook.This classifier can use protein sequences as input, and provides scores that allow users to identify a secreted protein.